
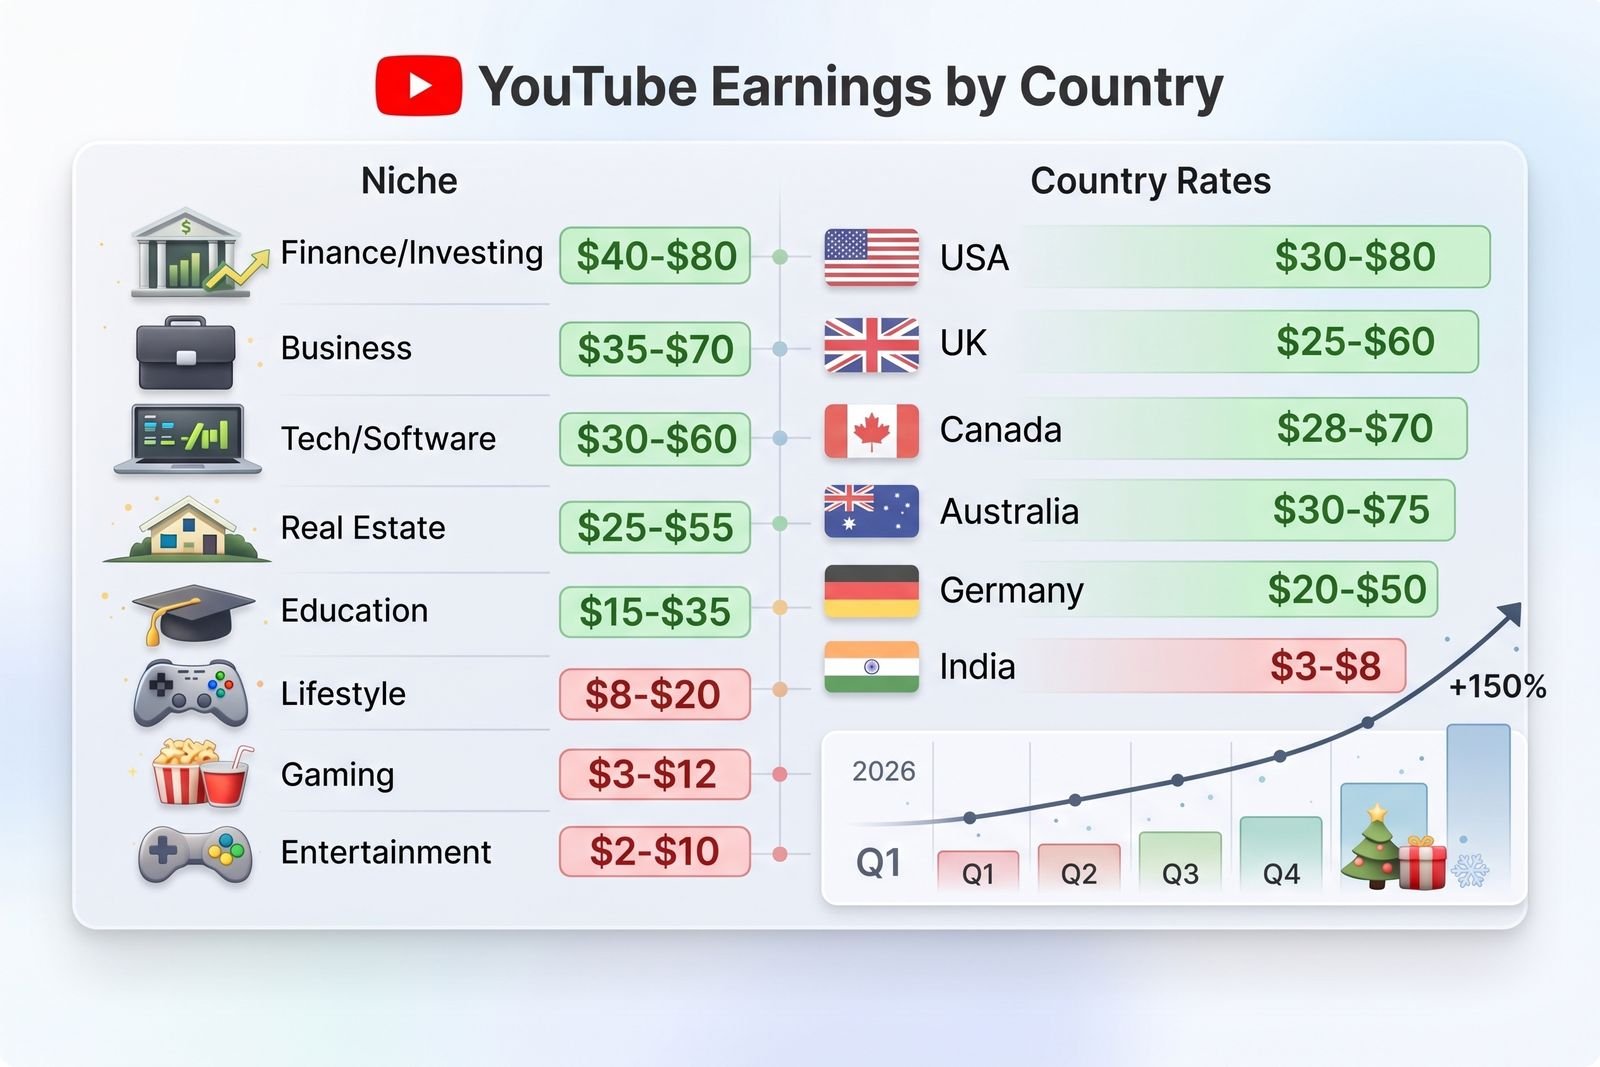
YouTube CPM and RPM by Country 2026
YouTube earnings by country decide why two channels with the same view count can earn very different amounts of money. A video watched one million times by viewers in the United States can produce many times more ad revenue than the same video watched mostly in South Asia, because advertisers pay different prices to reach different audiences. This guide gives you an updated 2026 look at YouTube CPM and RPM by country, a table of 40 countries by name, a top 10 ranking, breakdowns for Pakistan and Brazil, category benchmarks, and a simple calculator method you can use today.
What YouTube Earnings by Country Really Mean for Creators in 2026
Every monetized creator eventually asks the same question. How much does YouTube actually pay per 1,000 views? The honest answer is that it depends heavily on where your viewers live, what your video is about, and how long it runs.
Google does not publish an official CPM or RPM figure for any individual country. Every number you see online, including the ones in this article, is a third party estimate built from creator reports, dashboards and advertiser data. Estimates for the same country can differ by a factor of three between sources, so treat any table as a planning guide rather than a promise.
Geography matters because YouTube is an auction. Advertisers bid to place ads in front of specific audiences, and they bid more for audiences that are likely to buy. A viewer in Australia or Canada is worth more to a brand than a viewer in a market with lower consumer spending or a smaller digital ad industry. This is why creators who understand their audience map can forecast income far better than creators who only track total views.
CPM vs RPM Explained: Which Number Should You Trust?
Before you compare countries, you need to understand two terms that many creators mix up.
CPM means cost per mille, which is what an advertiser pays for 1,000 ad impressions. It is a gross figure that only counts views where an ad actually appeared, and it is calculated before YouTube takes its share.
RPM means revenue per mille, which is what you earn per 1,000 total video views. It is calculated after YouTube's revenue share, and it counts every view, including views where no ad was shown. Google explains this difference in its own YouTube Help definition of RPM.
Many websites claim RPM equals CPM multiplied by 0.55, but that shortcut only accounts for YouTube's share. It ignores the views that never carried an ad, such as viewers using ad blockers or videos where no advertiser matched. In the one data source that publishes both figures side by side, RPM lands at roughly one third of CPM rather than 55 percent of it.
Use CPM to compare how attractive different markets are to advertisers. Use RPM to plan your actual income. Your own RPM is always the most accurate figure, and you can find it in YouTube Studio under Analytics, then Revenue, with a country breakdown in the Geography view. If you are new to the monetization side, our guide to YouTube Partner Program requirements on Bilipedia explains what you need before ads can run at all.
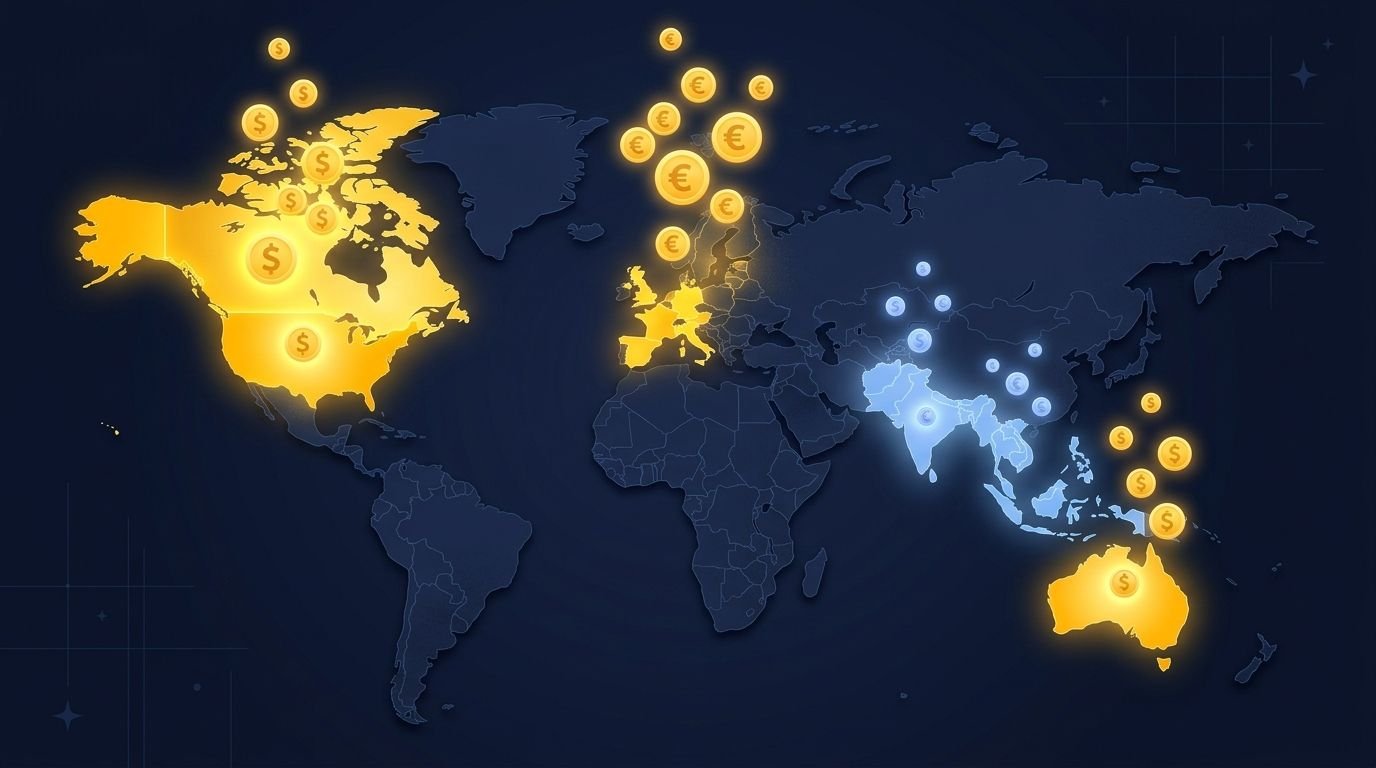
YouTube CPM by Country List 2026 With All Countries by Name
The table below shows 40 countries with the CPM ranges reported by third party trackers in early 2026 and the RPM per 1,000 views where a source publishes one. Where no source publishes an RPM, the figure is a conservative planning estimate of about one third of the CPM midpoint and is marked as estimated. Taiwan and Hungary have no reliable public figures, so no number is given.
| Country Region CPM Range RPM per 1,000 Views Data Type | ||||
|---|---|---|---|---|
| Australia | Oceania | $13.30 to $40.00 | $11.95 | Published |
| United States | North America | $14.67 to $36.00 | $10.81 | Published |
| Canada | North America | $9.93 to $32.00 | $9.62 | Published |
| New Zealand | Oceania | $10.21 to $31.00 | $9.29 | Published |
| Switzerland | Europe | $12.98 to $28.00 | $7.63 | Published |
| Norway | Europe | $11.21 to $28.00 | $6.66 | Published |
| United Kingdom | Europe | $8.91 to $24.00 | $7.12 | Published |
| Germany | Europe | $9.79 to $18.79 | $6.20 | Published |
| Denmark | Europe | $9.00 to $17.49 | $5.29 | Published |
| Netherlands | Europe | $8.62 to $17.77 | $5.86 | Published |
| Sweden | Europe | $10.00 to $16.00 | $3.67 | Published |
| Singapore | Asia | $7.00 to $17.75 | $5.37 | Published |
| United Arab Emirates | Middle East | $8.00 to $14.00 | About $3.70 | Estimated |
| Ireland | Europe | $3.00 to $18.20 | $6.01 | Published |
| Finland | Europe | $8.00 to $13.00 | $3.10 | Published |
| Austria | Europe | $4.00 to $16.86 | $5.10 | Published |
| Belgium | Europe | $3.50 to $15.43 | $4.67 | Published |
| Spain | Europe | $3.50 to $14.22 | $3.91 | Published |
| France | Europe | $6.00 to $11.00 | About $2.80 | Estimated |
| Japan | Asia | $4.00 to $10.53 | $2.90 | Published |
| South Korea | Asia | $4.00 to $9.00 | About $2.20 | Estimated |
| Portugal | Europe | $2.50 to $10.32 | $2.84 | Published |
| Italy | Europe | $4.00 to $8.00 | About $2.00 | Estimated |
| Poland | Europe | $2.50 to $5.00 | About $1.25 | Estimated |
| Czech Republic | Europe | $2.20 to $4.50 | About $1.10 | Estimated |
| Brazil | South America | $1.14 to $4.00 | $0.58 | Published |
| Mexico | North America | $1.41 to $3.50 | $0.62 | Published |
| Russia | Europe | $1.20 to $3.00 | $0.65 | Published |
| Nigeria | Africa | $0.35 to $2.89 | $0.92 | Published |
| Argentina | South America | $0.90 to $2.20 | $0.56 | Published |
| Thailand | Asia | $0.70 to $1.60 | About $0.38 | Estimated |
| India | Asia | $0.60 to $1.40 | $0.46 | Published |
| Malaysia | Asia | $0.55 to $1.30 | About $0.31 | Estimated |
| Philippines | Asia | $0.45 to $1.00 | $0.15 | Published |
| Indonesia | Asia | $0.40 to $0.95 | $0.41 | Published |
| Pakistan | Asia | $0.36 to $0.90 | $0.20 | Published |
| Vietnam | Asia | $0.35 to $0.85 | About $0.20 | Estimated |
| Bangladesh | Asia | $0.30 to $0.70 | $0.33 | Published |
| Taiwan | Asia | No reliable public estimate | No reliable public estimate | Not available |
| Hungary | Europe | No reliable public estimate | No reliable public estimate | Not available |
Some published RPM figures in this table look high compared with other guides. For example, other 2026 benchmarks put a United States audience at roughly $3 to $11 RPM for mixed content. If you want a cautious forecast, use the lower half of any published range and adjust after you see your own Studio numbers.
Where Other Countries Usually Fall
Data for every one of the world's countries does not exist in a reliable form, but the pattern is consistent enough to give you a rough guide. This grouping is an informal pattern, not a measured ranking.
| Tier Typical Countries | |
|---|---|
| Top tier | United States, Canada, Australia, New Zealand, Switzerland, Norway, United Kingdom, Germany, Denmark, Netherlands, Ireland, Sweden, Singapore |
| Upper middle tier | Finland, Austria, Belgium, Spain, France, Italy, Japan, South Korea, United Arab Emirates, Saudi Arabia, Qatar, Israel |
| Lower middle tier | Poland, Czech Republic, Portugal, Hungary, Greece, Turkey, Chile, South Africa, Brazil, Mexico, Argentina, Russia |
| Lower tier | India, Pakistan, Bangladesh, Indonesia, Philippines, Vietnam, Thailand, Malaysia, Egypt, Nigeria, Kenya, Sri Lanka, Nepal |
Top 10 Highest RPM YouTube Country Rankings for 2026
Based on the published RPM figures in the table above, these are the ten countries with the highest reported RPM per 1,000 views.
- Australia at about $11.95
- United States at about $10.81
- Canada at about $9.62
- New Zealand at about $9.29
- Switzerland at about $7.63
- United Kingdom at about $7.12
- Norway at about $6.66
- Germany at about $6.20
- Ireland at about $6.01
- Netherlands at about $5.86
Notice how many of these countries share English as a primary language. That is not a coincidence. English language content can reach the United States, Canada, the United Kingdom, Australia and New Zealand at the same time, which gives creators access to five of the ten strongest markets with a single video. Singapore, Denmark and Austria sit just outside the top ten and are also worth watching if your niche has a local audience there.
Why Do YouTube CPM Rates Vary So Much by Country
CPM differences are driven by several forces that work together.
Advertiser demand and competition. In markets with many large brands bidding for attention, the auction price rises. Smaller ad markets have fewer bidders, so prices stay low even when viewership is huge.
Purchasing power. Advertisers pay more to reach people who can afford their products. A software company or a bank will pay far more to reach a viewer in Canada than to reach a viewer in a market with lower average household income.
Ad market maturity. Countries with well developed digital advertising industries, reliable payment systems and strong ecommerce give advertisers better tracking and better returns, which supports higher bids.
Language and content fit. Advertisers often target by language. English is the most commercially valuable language on the platform because so many high spending audiences use it.
Seasonality. Ad budgets swell in the fourth quarter because of holiday shopping. Several trackers report CPMs running 30 to 50 percent higher from October through December, then dropping in January and February.
Ad fill and format. Not every view carries an ad. In some countries a larger share of views goes unmonetized because fewer advertisers are bidding, which pulls RPM down even when CPM looks acceptable.
Content category. The topic of your video sets a ceiling on what advertisers will pay, and your audience location decides how close you get to that ceiling. We cover this in the category section below.

YouTube Earnings by Country in Pakistan
Pakistan has one of the largest creator communities in South Asia, and many creators ask what to expect. Third party trackers place the CPM for Pakistani audiences between about $0.36 and $0.90, with a published RPM near $0.20 per 1,000 views. Other 2026 guides that measure by niche report a wider RPM range of roughly $0.40 to $1.50, which shows how much the topic changes the result.
In practical terms, 100,000 views from a mostly Pakistani audience might produce anywhere from about $20 to $150 depending on your niche, video length and ad fill. A finance or technology channel will sit at the top of that range, while general entertainment and vlogs will sit near the bottom.
Pakistan based creators are not locked into those numbers. The most effective strategies are:
- Publish in English on topics with international demand, such as software tutorials, freelancing, online business, artificial intelligence tools and personal finance, where advertisers compete regardless of where the creator lives.
- Use English titles, descriptions and captions so the algorithm can recommend your videos to viewers in the United States, United Kingdom, Canada and Australia.
- Add subtitles or dubbed audio tracks in several languages so one video can earn from many markets.
- Make longer videos that support mid roll ads, because longer watch sessions create more ad opportunities.
- Diversify with sponsorships, affiliate links and digital products, since ad income alone can be small at low RPM levels.
Remember that earnings are paid through AdSense, so you should keep your payment and tax details accurate and speak with a local accountant about reporting foreign income. You can learn how monetization eligibility works in our YouTube SEO guide, which also covers how to rank videos for international search terms.
Brazil RPM YouTube Shorts and Shorts Earnings by Country
Shorts follow a different payment model from long form videos. Instead of earning from ads placed directly on your video, Shorts income comes from a pooled share of ad revenue that is divided among creators based on views, and creators receive 45 percent of their allocated share compared with 55 percent on long form ads. Because Shorts play in a fast scrolling feed with far fewer ad slots, the RPM is much lower.
Across 2026 benchmarks, average Shorts RPM commonly sits between $0.03 and $0.08 per 1,000 views. Some country level tables put the United States and United Kingdom higher, around $0.18 to $0.30, while India, Pakistan and Bangladesh sit near $0.02 to $0.05.
Brazil is one of the largest YouTube audiences in the world, but it is a volume market rather than a high RPM market. Brazil's long form RPM is reported near $0.58, and for Shorts a planning figure near $0.04 per 1,000 views is often used in public calculators. That means 10 million Brazilian Shorts views may bring in only a few hundred dollars, so treat Brazil Shorts as a growth and reach channel first and an income source second.
The smart approach is a blended strategy. Use Shorts to discover new viewers, then move those viewers to long form videos where RPM is many times higher. Use our YouTube Shorts monetization resource on Bilipedia to plan that funnel.
YouTube RPM by Category List
Your niche sets the ceiling for what advertisers will pay, and your audience location decides how much of that ceiling you reach. The ranges below are approximate 2026 planning figures compiled from public benchmarks. Sources disagree, so use them as a starting point.
| Category Typical RPM Range per 1,000 Views Why It Pays That Way | ||
|---|---|---|
| Finance and investing | $8 to $20, higher with US audiences | Banks, brokers and insurers pay premium rates |
| Business and marketing | Above average | Software and service companies target buyers |
| Technology and software | $4 to $10 | Strong product advertiser demand |
| Health and wellness | $8 to $15 with US audiences | High value health advertisers, strict policy rules |
| Education and tutorials | $2.75 to $5.50 | Steady demand and long watch time |
| Fitness | $2 to $7 | Mixed advertiser interest |
| Gaming | $1 to $3, esports and hardware higher | Huge supply of impressions, younger audience |
| Entertainment and vlogs | $1 to $4 | Broad reach, low advertiser specificity |
| YouTube Shorts | $0.03 to $0.08 | Pooled revenue and fast scrolling |
A finance channel with an audience in India can sometimes earn more per view than an entertainment channel with a United States audience, because advertiser demand for the niche offsets part of the location gap. The best results come from combining a valuable category with an audience in a strong market.
YouTube Earnings by Country Calculator: How to Estimate Your Income
You do not need special software to estimate your income. You need three things, your monthly views, the share of views from each country, and an RPM for each country.
The formula is simple. Divide your views by 1,000, then multiply by RPM.
Here is a worked example for a channel with 100,000 monthly views.
- 50 percent of views from the United States at an RPM of $5. That is 50,000 views divided by 1,000, multiplied by $5, which equals $250.
- 20 percent of views from the United Kingdom at an RPM of $4. That is 20,000 views divided by 1,000, multiplied by $4, which equals $80.
- 30 percent of views from Pakistan at an RPM of $0.20. That is 30,000 views divided by 1,000, multiplied by $0.20, which equals $6.
The total is $336, which gives a blended RPM of about $3.36. Notice how the 30 percent Pakistani audience adds only a tiny share of the income. This is why blended RPM is a much better predictor than any global average.

To find your real audience split, open YouTube Studio, go to Analytics, then Audience, and look at the top countries. Then compare your actual RPM against the ranges in this article. If your RPM is far below the benchmark for your country and niche, look at video length, ad placement and topic before blaming the market. You can also test numbers quickly with the Bilipedia YouTube money calculator.
Keep expectations realistic. Earnings estimates are not guarantees, and no calculator can promise a payout. Actual income depends on ad demand, viewer behavior, policy compliance and seasonality.
How to Get More Viewers From Higher Paying Countries
You cannot buy or force viewers from a specific country, and you should never use fake traffic, click farms or view bots. These break YouTube policies and AdSense rules, and they can lead to demonetization or a permanent ban. The ethical path is to make content that genuinely appeals to those audiences.
- Choose topics with global commercial demand. Personal finance, software, careers, health information, business skills and education travel well across borders.
- Write in clear, natural English. Use searchable English titles, descriptions and tags, and keep your language simple so it translates well.
- Add subtitles and audio tracks. YouTube supports multiple language tracks, which helps one video reach many markets.
- Publish when your target audience is online. For United States viewers, afternoon Eastern Time is a common choice.
- Study your analytics. Look at which countries already watch and which videos travel furthest, then make more like them.
- Improve retention. Strong watch time helps recommendations, and longer videos can carry more mid roll ads.
- Avoid misleading targeting. Do not stuff country names into titles unless the video is truly relevant, since that harms viewer trust and policy compliance.
Free Tools to Check Your SEO Score
Better discoverability supports better earnings, because more qualified views means more chances to reach higher paying audiences. These free tools help you check both your YouTube optimization and your website SEO.
- vidIQ offers a free video SEO score with keyword and tag suggestions for YouTube.
- TubeBuddy provides video optimization scoring and keyword research inside YouTube Studio.
- Google PageSpeed Insights tests how fast and mobile friendly your website or blog page is.
- SEOptimer runs a free website audit and gives an overall SEO grade.
For deeper reading on ranking and audience growth, visit Bilipedia for more creator guides and tools.
Final Thoughts on YouTube Earnings by Country
YouTube earnings by country come down to one idea. Advertisers pay for attention from audiences that are valuable to them, and location is a large part of that value. The United States, Australia, Canada, New Zealand, Switzerland and the United Kingdom sit at the top, while markets such as India, Pakistan, Bangladesh and the Philippines sit at the bottom, although they offer enormous reach.
Do not let a low RPM discourage you. Many successful creators in lower RPM countries build large channels by choosing a strong category, making English content with global appeal, creating longer videos, and adding sponsorships and affiliate income on top of ads. Check your own numbers in YouTube Studio each month, compare them with the benchmarks here, and adjust your strategy based on what your audience actually does.
Frequently Asked Questions About YouTube Earnings by Country
Why do YouTube CPM rates vary so much by country?
CPM reflects how much advertisers are willing to pay to reach viewers in each market. Countries with higher purchasing power, strong consumer spending and mature digital advertising industries, such as the United States, Canada, Australia and the United Kingdom, attract more bidders and higher prices. Markets with lower average incomes or smaller ad industries see lower bids. Language, seasonality, video category and the share of views that actually show ads also change the final number. This is why the same video can earn very different amounts depending on where it is watched.
How can I get more viewers from high CPM countries?
Start by creating content on topics that have real demand in those markets, and publish it in clear English with searchable titles, descriptions and captions. Add subtitles or additional audio tracks so more people can understand your videos. Post when your target audience is most active, study your Analytics geography report to see which videos already travel well, and improve retention so the algorithm recommends you more widely. Never use fake traffic or paid view schemes, because they violate YouTube policies and put your monetization at risk.
Does YouTube pay the same CPM for live streams and videos?
No, the rates are often different. Live streams commonly earn a lower CPM than standard videos because viewers may skip or ignore ads more easily and ad breaks can be less predictable. However, long streams can collect a large number of watch hours, so the total revenue can still be strong even when the rate per impression is lower. Live streams also allow extra income from Super Chat and channel memberships, where YouTube keeps 30 percent of the revenue.
What content gets the highest CPM regardless of country?
Finance, investing, insurance, business, software and technology content usually attract the highest CPM in nearly every country, because advertisers in those industries compete hard for engaged viewers and each customer is worth a lot of money. Health information and education content can also perform well. Entertainment, gaming and general vlog content tends to earn less per view because the advertiser interest is broader and less specific. A strong category can partly offset a lower value audience location.
How accurate are these estimates?
They are planning guides, not measurements. Google does not publish official CPM or RPM figures by country, so every number comes from third party trackers and creator reports, and those sources can disagree by a factor of three for the same country. Your real rate also changes with your niche, video length, ad formats, audience mix and the time of year, with the fourth quarter often running higher. The only fully accurate number is the RPM shown in your own YouTube Studio under Analytics, then Revenue.
What is the difference between CPM and RPM?
CPM is the amount advertisers pay per 1,000 ad impressions, before YouTube takes its share, and it only counts views where an ad was shown. RPM is the amount you earn per 1,000 total video views after YouTube's share, and it includes views that never displayed an ad. Because of this, RPM is always lower than CPM, and it is the better number for forecasting your income. Use CPM to compare how valuable different countries or niches are, and use RPM to estimate what will actually reach your bank account.